Phase diagrams are used in Materials Science and Engineering to determine what the stable (equilibrium) phases are at a given pressure, temperature, and composition. In this lab, the students are given several mixtures of two organic crystalline polymers with a known phase diagram. They heat and cool the samples under the optical microscope, and analyze the microstructures in the resulting images. Phase fractions and transition temperatures are compared to the published phase diagram. The rate of cooling is also varied to show how non-equilibrium conditions can change the results.
PROCEDURE – OPTICAL MICROSCOPY
Equipment Used
- Optical microscopes (Nikon and Olympus)
- Linkam hot-stage and controller (PE 94 or PE 95), with Linksys 32 software where appropriate
- Water circulating unit for the hot-stage
- Hot plate, microscope slides, slip covers and spatulas for sample prep
- Video camera and Infinity Analyze software for image capture
Materials Tested
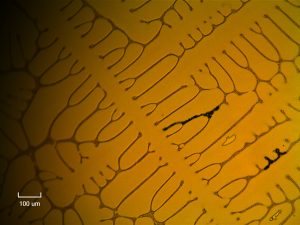
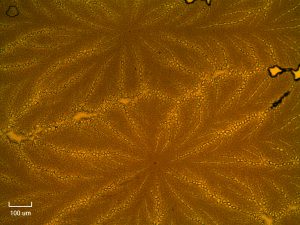
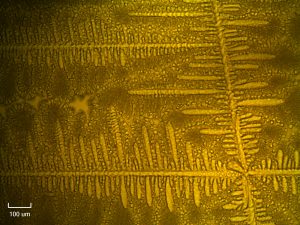
- Succinonitrile-camphor alloy of eutectic composition (~23.6% camphor)
- Succinonitrile-camphor alloy of hypoeutectic composition (~5-10% camphor)
- Succinonitrile-camphor alloy of hypereutectic composition (~30-35% camphor)